WorkGraph web UI
The web UI provides an intuitive interface to view and manage WorkGraphs. This tutorial focuses on using the web UI to explore WorkGraphs. For full details on the aiida-gui package, refer to the aiida-gui documentation.
Installation
Install the web UI package via pip:
pip install aiida-gui-workgraph
Start the web server
To launch the web interface, run:
aiida-gui start
Then open your browser and go to: http://127.0.0.1:8000/workgraph
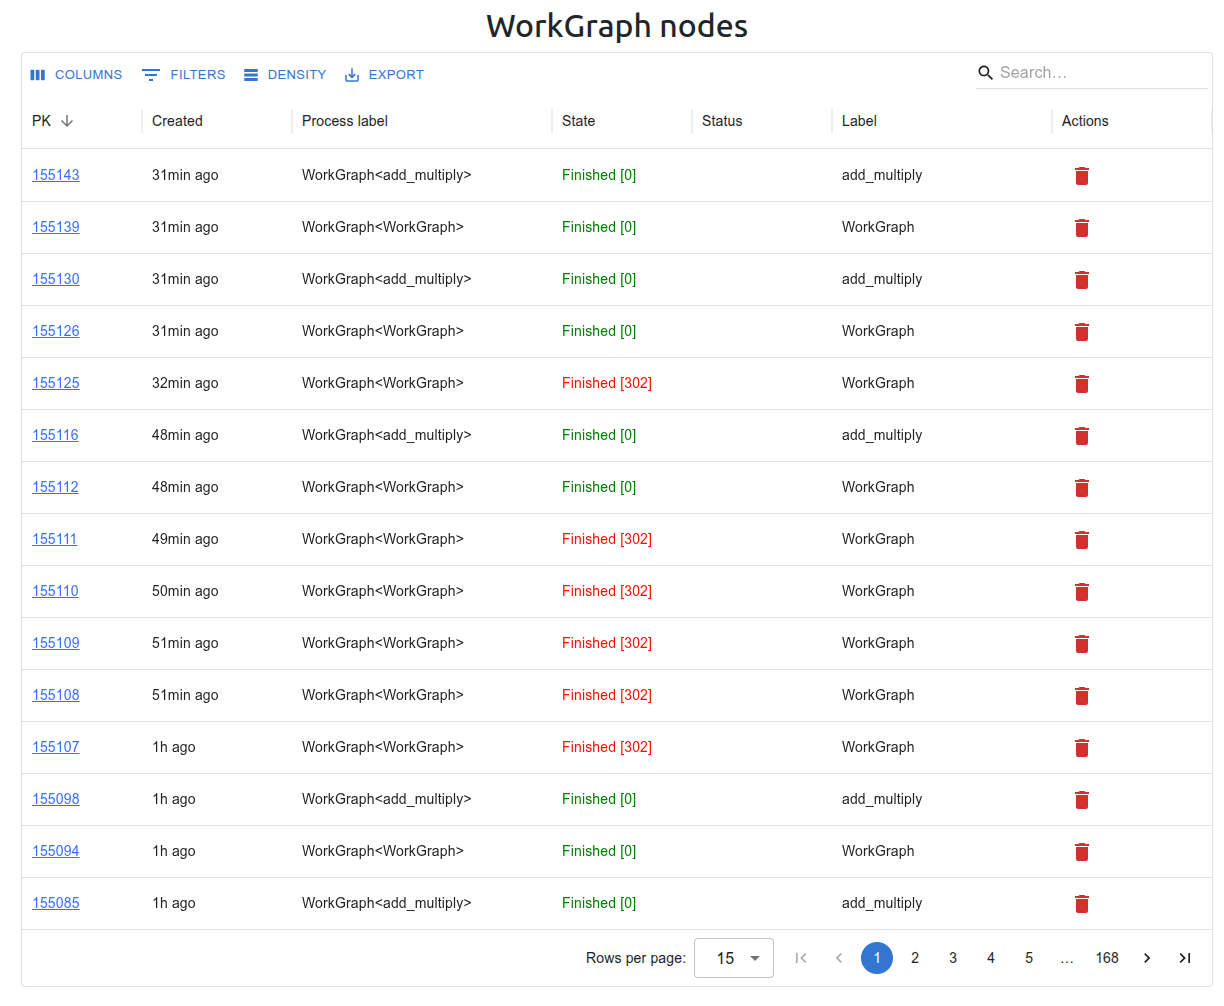
WorkGraph table
The main table displays all the WorkGraphs in your history. You can:
Click a WorkGraph to view its details.
Delete a WorkGraph using the trash icon.
Pause, play, or kill running WorkGraphs.
WorkGraph detail view
Each WorkGraph has a detail view with four tabs:
Editor: Visualizes the workflow graph. Inspect tasks and control execution (pause, play, kill).
Summary: Displays a summary of the process, including inputs, outputs, and called processes.
Logs: Shows the logs of the WorkGraph.
Timeline: Displays the task execution timeline.
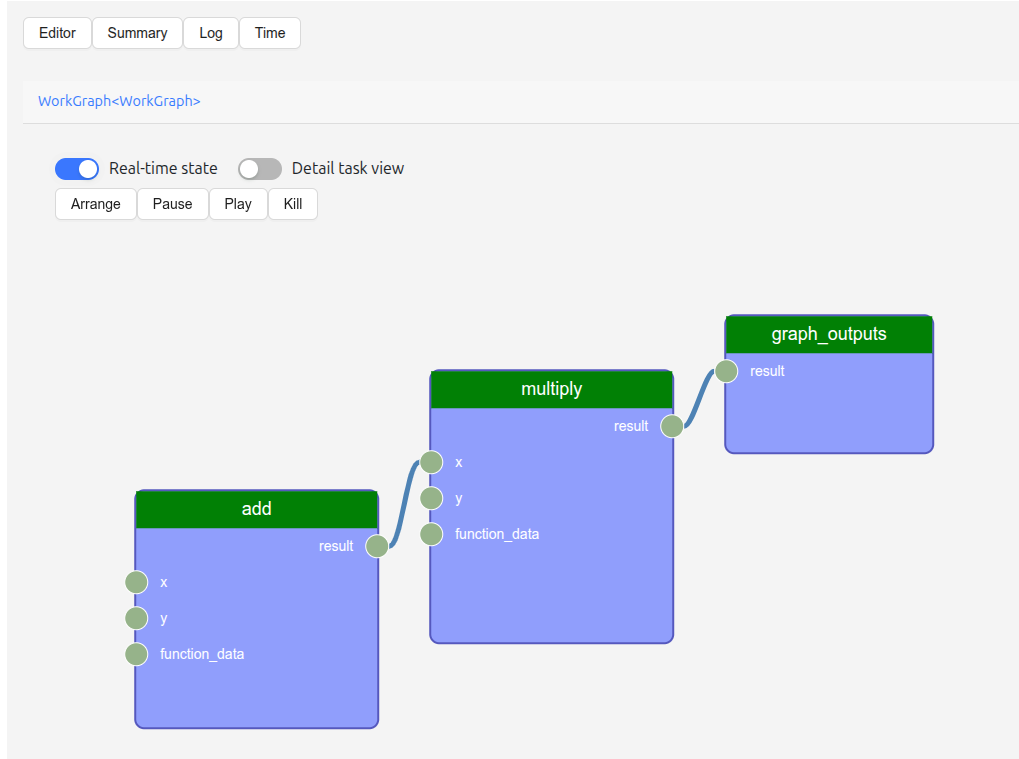
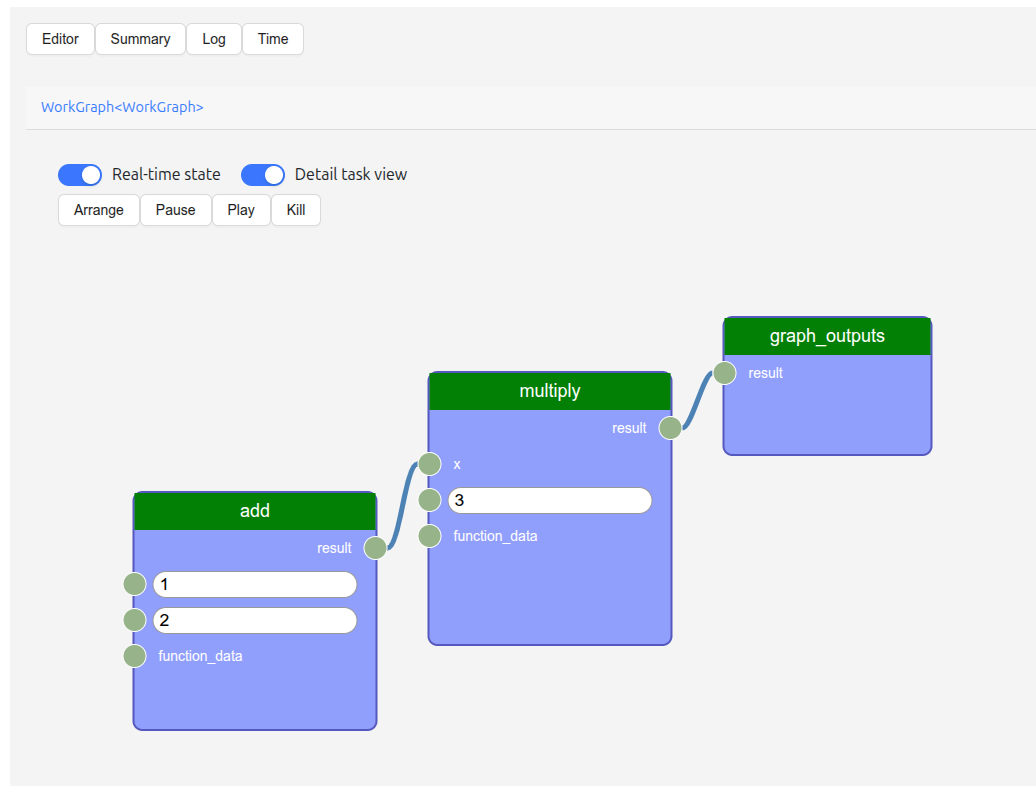
Editor tab
This tab shows the workflow graph. Click on a task to see its inputs and outputs.
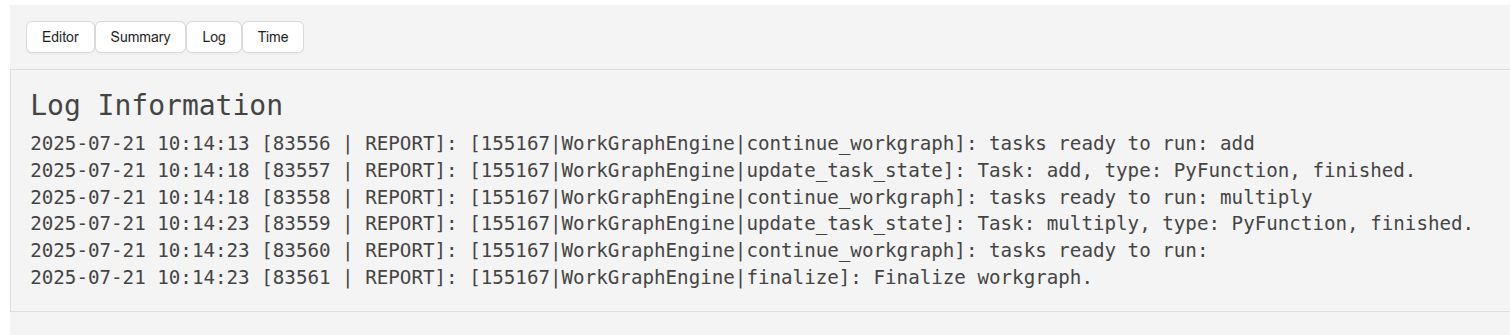
Logs
The Logs tab shows real-time and historical logs for the WorkGraph process.
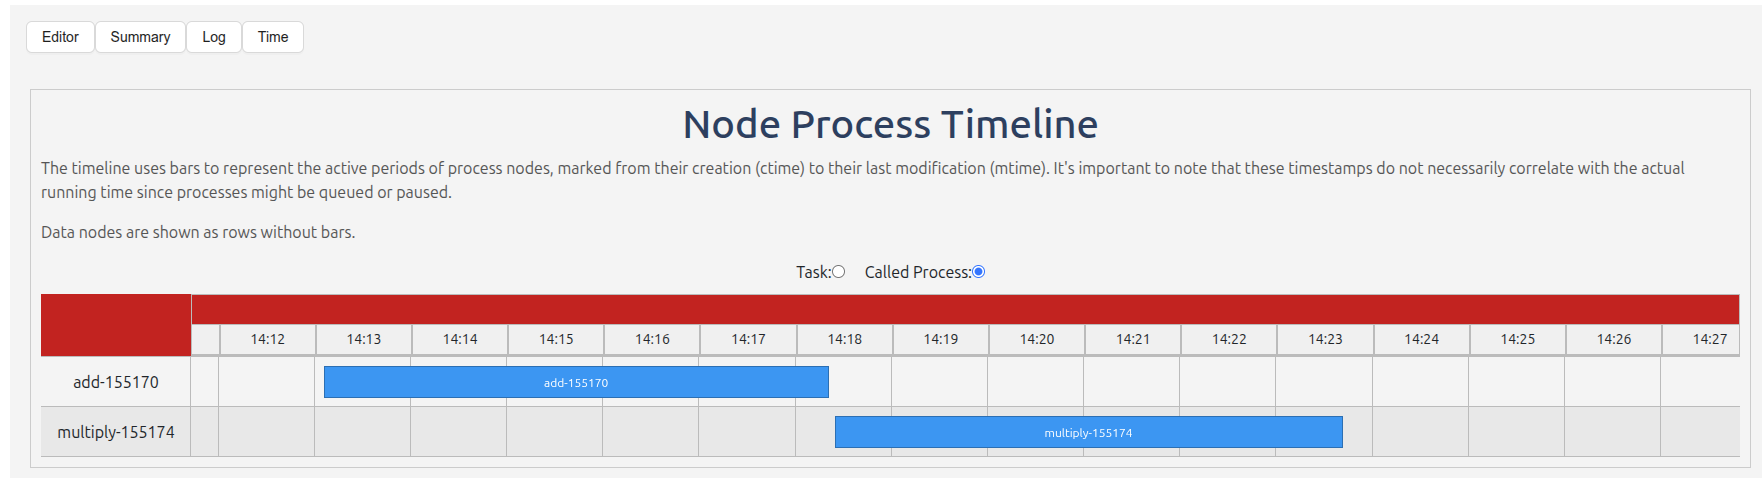
Timeline
This tab visualizes when each task was executed, helping to analyze task durations and dependencies.
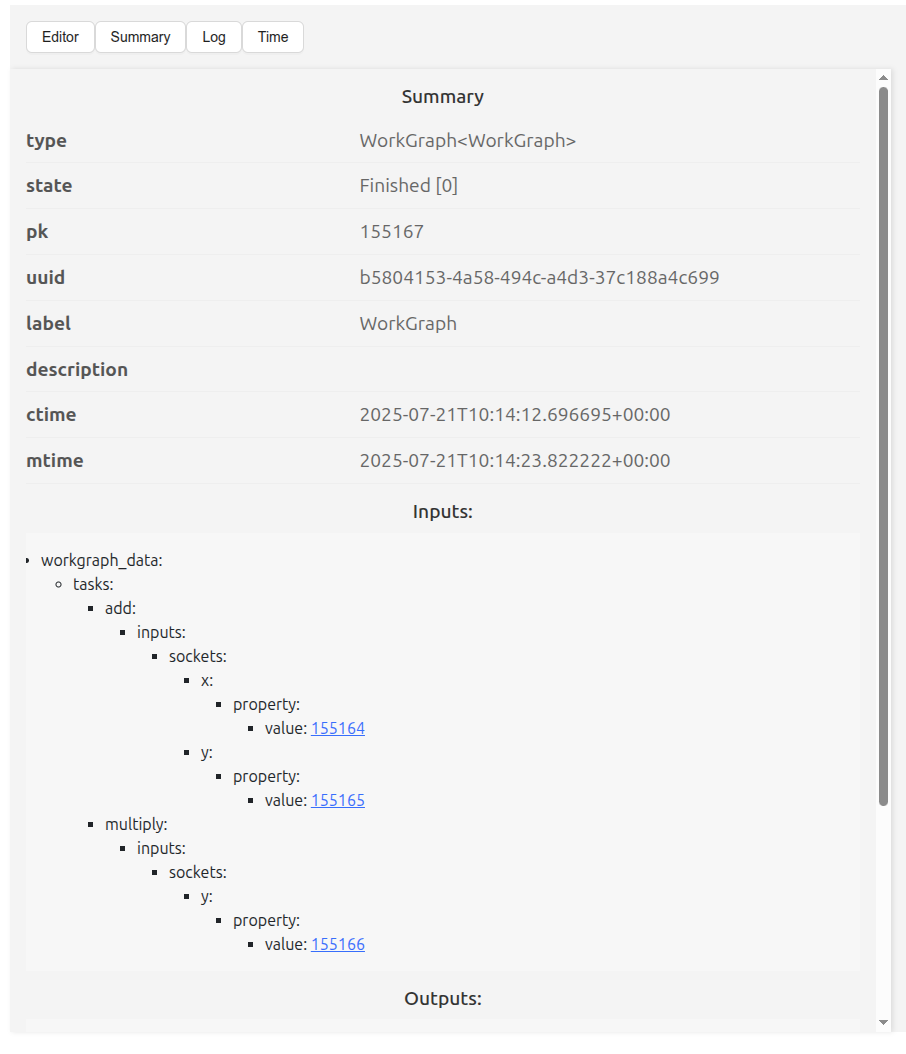
Summary
The Summary tab provides a structured overview of the WorkGraph, including input/output metadata and called processes.
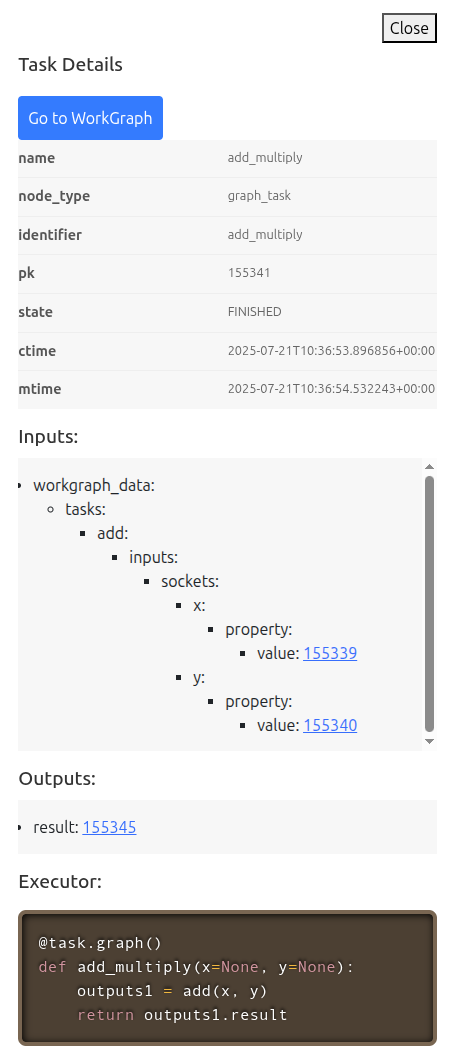
Task details
Clicking a task in the graph opens a detail panel on the right. This panel shows:
A summary of the task process
The task’s inputs and outputs
The source code of the task
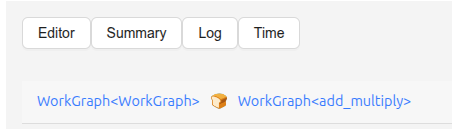
Nested WorkGraphs
If the task is itself a WorkGraph (e.g., a Graph or WorkGraph task), a Goto workflow button appears in the task detail panel.
Clicking this navigates to the sub-WorkGraph.
A breadcrumbs navigation bar appears at the top, showing the current and parent WorkGraphs.
Detailed socket view
Enable the Detail task view toggle to see the actual values of inputs and outputs for each task directly in the graph view.
Conclusion
In this tutorial, we demonstrated how to use the web UI to:
View all existing WorkGraphs
Navigate through and inspect tasks and sub-workflows
Analyze task logs, timelines, and summaries
Interactively control task execution